NPS Survey Redesign
- Category
- Web Platform · Insurance
- Year
- 2025
- My role
- Product Designer — I owned the problem analysis, the flow and the UI
- Team
- CX team, Product Owner, Frontend and Backend developers
- Timeline
- 2 sprints
- Platform
- Web platform (customer cabinet)
- Launch
- October 2025
- Result
- +25% boost in NPS metrics, and a survey that finally explains low scores
Problem
Why were some users "accidentally" giving us low scores?
Discovery
While analyzing our NPS survey, we noticed a very strange pattern. Some users gave us low scores. But when our CX team reached out to them, they kept hearing the same thing: "Oops, that was an accident. I'm actually happy with the product!"
Scale
The CX team called customers who had left low scores. The answer kept repeating: many of them said the score was a mistake. This was not a handful of odd cases — it was a pattern.
The mystery
This became a real UX mystery for me. How can someone accidentally give a bad rating? It was a clear signal that the problem wasn't the user, but the design itself. It was triggering 'autopilot' errors and leading to 'dirty' data.
Decision
I took ownership of the problem and redesigned the flow end to end. The CX team brought the customer calls and feedback, and the developers shaped what was possible in the cabinet.
Aggressive interruption
The survey appeared as a full-screen modal, completely blocking the interface. This interrupted the user mid-task and caused instant irritation.
Weak feedback
The color contrast between a "6" (negative) and a "7" (neutral) was almost unnoticeable. A user on "autopilot" aiming for the "green zone" could easily miss it without even realizing it.
No anchors or context
The numbers were just numbers. We didn't give the user any anchors (e.g., "0 = Definitely not," "10 = Absolutely") or confirm their choice. What did a "5" even mean? It was unclear.
A missed opportunity
We never asked "Why?" to our dissatisfied users. We were getting a bad score but had zero insight into the reasons behind that negative feedback.
Conclusion
It was clear that a complete redesign, one based on user respect, was needed.
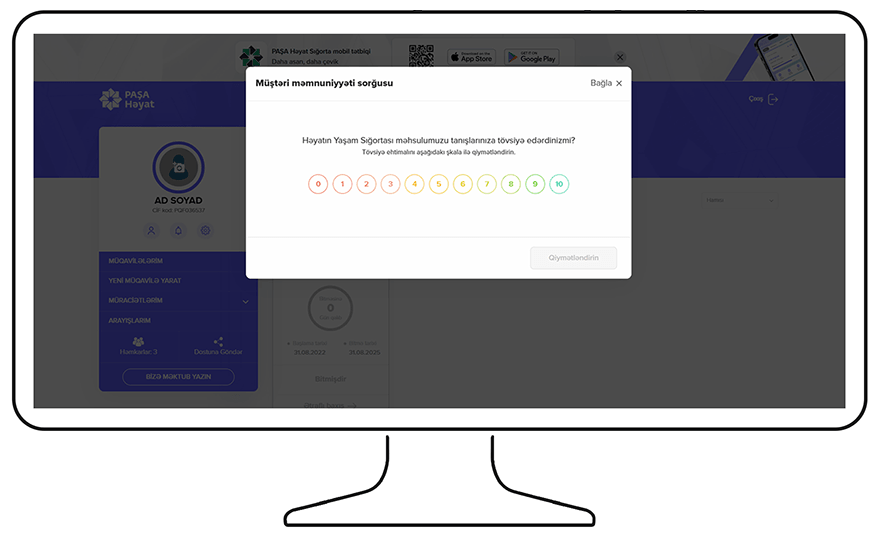
The old survey — a modal that blocks the whole interface.
Interface text · Azerbaijani → English
- Müştəri məmnuniyyəti sorğusu
- Customer satisfaction survey
- Bağla
- Close
- Həyatın Yaşam Sığortası məhsulumuzu tanışlarınıza tövsiyə edərdinizmi?
- Would you recommend our Life Insurance product to your acquaintances?
- Tövsiyə ehtimalını aşağıdakı şkala ilə qiymətləndirin
- Rate the likelihood of recommending on the scale below
- Qiymətləndirin
- Submit rating
Wireframes
Exploring the options before choosing one
Approach
I started with the first ideas in wireframes. Even at that early stage, it was clear this wasn't just a "button redesign."
Three decisions
I treated the survey as three separate design decisions — where it sits, what the scale looks like and when it appears — and compared options for each one.
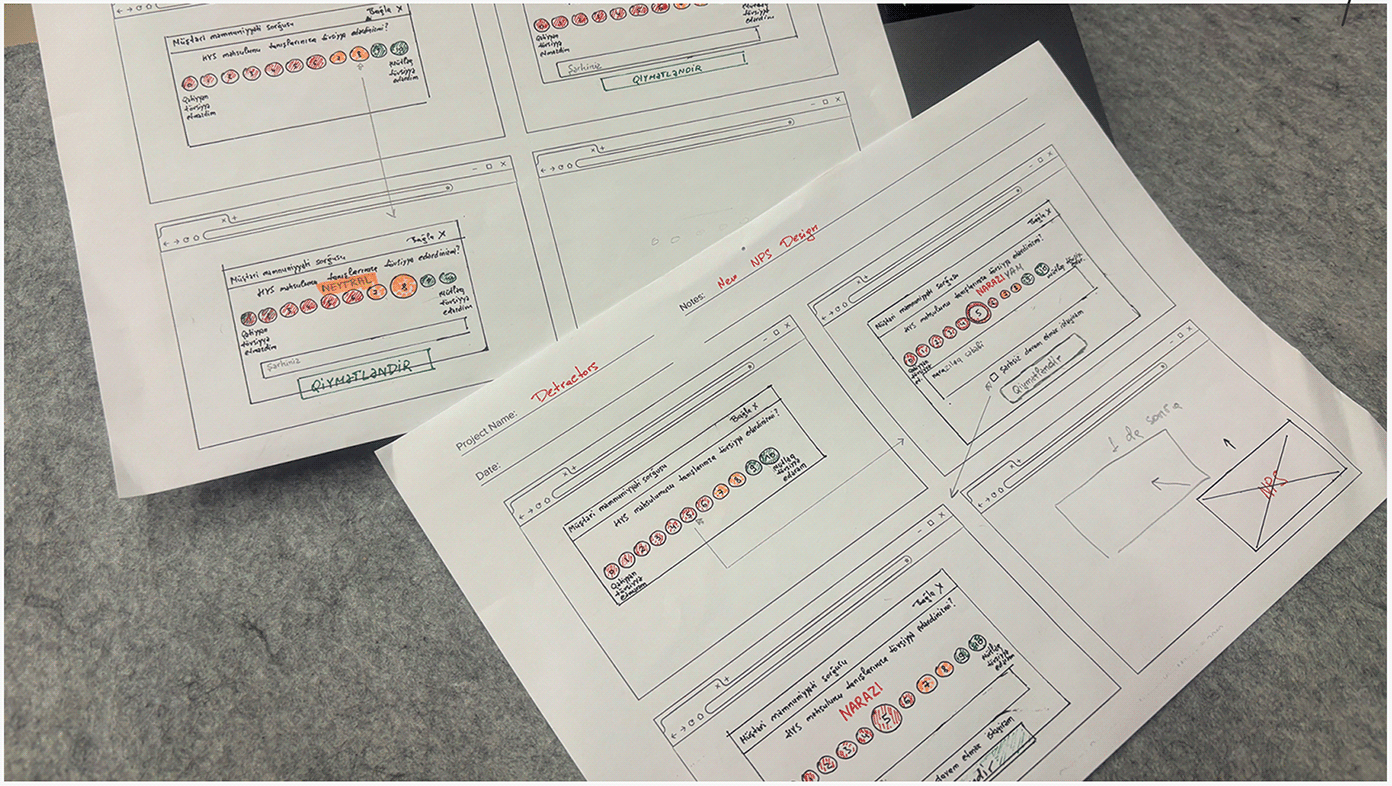
Wireframes — the first ideas for the new NPS flow.
01 · Where does the survey sit?
Full-screen modal
The old way. It blocks the task and forces an answer from an irritated user.
Corner widget
✓ ChosenStays out of the way and leaves the choice to the user. The page keeps working underneath.
Top banner
Pushes the layout down and is easy to ignore as one more promo strip.
02 · What does the scale look like?
Emoji faces
Friendly, but five faces cannot give the 0–10 detail NPS needs.
Slider
Easy to mis-set with a mouse or a thumb, and the final value is not obvious.
0–10 buttons
✓ ChosenThe standard NPS scale: results stay comparable with our history. Clarity comes from color and labels.
03 · When does it appear?
On every login
Predictable, but it catches people before they have done anything to rate.
Once the page is settled
✓ ChosenA few seconds after the user lands, and never in the middle of a form or a payment.
At a random moment
Cheap to build, but it keeps interrupting people at the worst time.
Presentation
Changing how — and when — the survey is presented
Problem
Users already have very little motivation to spend time on this. Our old approach interrupted their task, meaning we were practically guaranteeing a response from an already-angry user.
Solution
With the new design, our survey appears as a small, unobtrusive widget in the bottom-right corner. We no longer interrupt their flow. The user decides when (or if) to engage, which has a huge positive impact on the honesty and quality of our data.
When it appears
About 10 seconds after the customer lands on the main page — and never while they are filling in a form or making a payment.
How often
At most once every 90 days per customer, so the survey stays a question and never becomes a nuisance.
If it is closed
Pressing ✕ is respected: the customer is not asked again for 30 days.
If it is ignored
An ignored widget folds into a small tab after 30 seconds and may return on the next visit, up to 3 times in a cycle. Then it waits for the next one.
On mobile
On narrow screens the corner widget becomes a bottom sheet with larger touch targets, so a thumb can hit the right number.
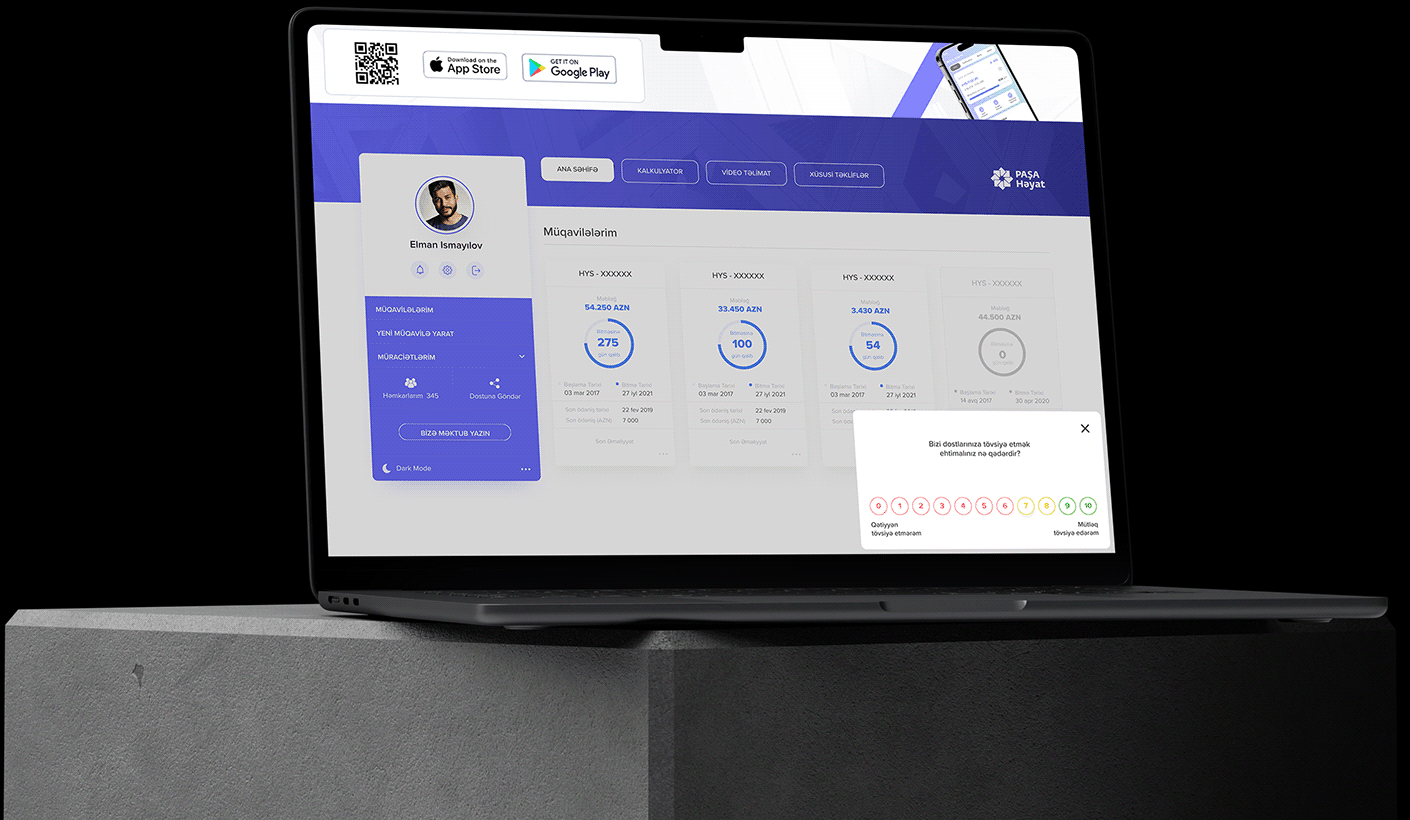
The new survey — a small widget in the corner.
New Design
Breakdown of the new design
6 vs. 7
The old design had a soft gradient, but the contrast between a "6" and a "7" was almost invisible. For a user on autopilot there was no real difference — yet for our NPS score this is critical: a 6 is a Detractor, but a 7 is a Neutral. We created clear, high-contrast color groups: Red (0–6), Yellow (7–8) and Green (9–10). No more confusion.
Anchoring the score
We kept hearing feedback like "I put 5, I'm happy with the product!" Users didn't understand the scale. To fix this, we added two layers of context.
Text anchors
Labels under '0' and '10' define the two extremes of the scale.
Instant feedback
After a user clicks a number, we show a clear status label above it ("Dissatisfied," "Neutral," or "Excellent") so they have zero doubt about what their vote meant.
Capturing the "why"
Just getting a low score isn't enough — we needed to know the reason. When a user selects a score from 0–6, we optionally show a few checkboxes with common issues and a field for their own feedback. This gives us actionable insights to actually fix the problems, not just stare at a number.
Accessibility: not by color alone
Color is never the only signal. Every group is also explained by text — the two anchors under the scale and the status label ("Dissatisfied", "Neutral", "Excellent") after a choice.
Known gap: digit contrast
Checking the colored circles, the digits are the weak spot. The thin yellow digits (7–8) on white are well below the WCAG AA ratio of 4.5:1, and red and green are borderline. Next step: darken the digit color and keep the lighter outline.
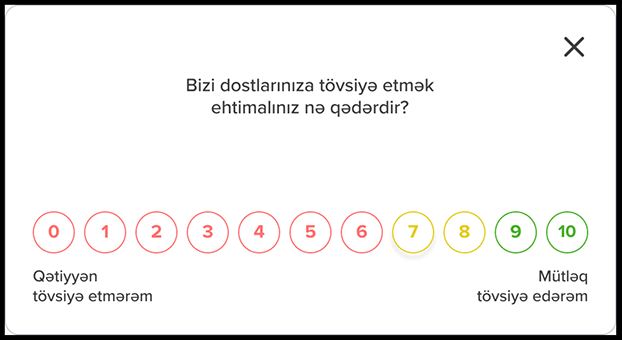
Color groups and text anchors
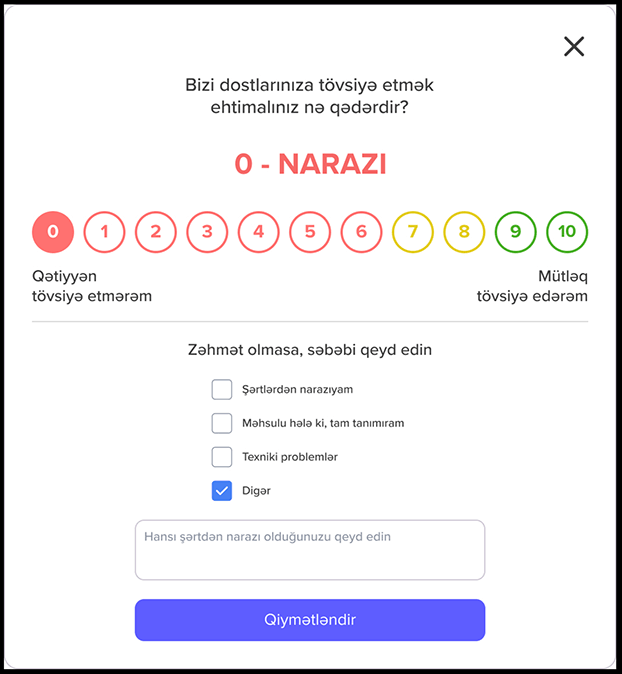
Instant feedback and the reason for a low score
Interface text · Azerbaijani → English
- Bizi dostlarınıza tövsiyə etmək ehtimalınız nə qədərdir?
- How likely are you to recommend us to your friends?
- Qətiyyən tövsiyə etmərəm
- Definitely would not recommend
- Mütləq tövsiyə edərəm
- Would absolutely recommend
- 0 - NARAZI
- 0 – DISSATISFIED
- Zəhmət olmasa, səbəbi qeyd edin
- Please state the reason
- Şərtlərdən narazıyam
- I'm unhappy with the terms
- Məhsulu hələ ki, tam tanımıram
- I don't fully know the product yet
- Texniki problemlər
- Technical problems
- Digər
- Other
- Qiymətləndirin
- Submit rating
Before & After
Four fixes, side by side
At a glance
Each fix answers one cause of accidental scores. The old version is on the left, the new one on the right.
Interruption → quiet widget
A blocking full-screen modal became a small corner widget.
Before
After
Faint gradient → clear color groups
6 (detractor) and 7 (neutral) can no longer be mistaken for each other.
Before
After
Bare numbers → anchors and instant feedback
Both ends of the scale are named, and the chosen score gets a status label.
Before
After
No reason → optional “why”
Low scores now come with reasons the team can act on.
Before
After
Measurement
How I judged whether it worked
Honest limits
The old and the new survey never ran side by side, so this is a before / after comparison, not an A/B test. Other things in the product changed over the same months.
What I looked at
The NPS trend before and after the launch, the share of respondents, how many low scores came with a reason, and what the CX team heard in their follow-up calls.
Why I trust it
The main signal was the simplest one: the calls where customers said "it was an accident" stopped being the story. Numbers and conversations pointed the same way.
Result
Clean data, real decisions
Impact
By eliminating accidental low scores, we restored the integrity of our NPS metrics. Now, PASHA Life makes strategic product decisions based on genuine user feedback, not interface friction.
Data in use
The strongest proof is not the score — it is that the new "why" field already changed a decision the team made.
NPS by month
Jul – Dec 2025 · survey redesign launched in October
Before / after
- NPS4151+10 pts · ≈ +25%
- Response rate22%12%fewer, but honest answers
- Low scores with a reason—38%new field
- Low scores later called a mistakeCommonRareper CX calls
A decision made from the new “why” field
“I don't fully know the product yet”
It topped the reasons behind low scores, so the team moved the video tutorial onto the dashboard for new customers instead of hiding it in the menu.
Illustrative data — shape of the result, not final figures.
Takeaways
What I learned and what I would do differently
Learned: design
Bad data is often a design problem, not a user problem. If people give a wrong answer "by accident", look at the interface first.
Learned: the “why”
A number alone does not help a team. The "why" next to it is what turns a score into a decision.
Differently: test it
I would A/B test the new survey against the old one instead of replacing it outright. That would give a clean, causal number.
Differently: baseline
I would agree on the success metrics with the CX team and record the baseline before launch, not after.
Differently: mobile
I would test the bottom-sheet version on real phones earlier, and fix the digit contrast in the very first iteration.